

Introduction
Breast cancer is the most common type of cancer in women. Neoadjuvant chemotherapy (NAC) has become the initial treatment for locally advanced breast cancer.1 Its use has expanded after the recommendation for using NAC to T1c-N0 patients with human epidermal growth factor receptor 2 (HER2) positive and triple negative in the 2023 NCCN guideline. With NAC, the stage of breast cancer can be reduced, and it can allow breast-conserving surgery (BCS) to be performed in patients who need a mastectomy.2 It is prognostic for survival and disease-free survival.3 When a complete axillary response is achieved, sentinel lymph node biopsy (SLNB) can be performed instead of axillary dissection (AD), avoiding complications caused by the latter. However, not all patients benefit from NAC. For patients who would not benefit from NAC, consequences such as loss of time, chemotherapy toxicity, and increased costs may arise.4 In this respect, it is important to be able to predict the patients who would benefit from NAC. Positron emission tomography-computed tomography (PET-CT) is a technique that has been increasingly used in recent years. There are many studies investigating the effectiveness of PET-CT in predicting pathological response after NAC.5–9 However, the majority of these studies are studies conducted with PET-CTs taken after NAC. Most of them were conducted without comparison with other factors that may affect the response to NAC and are few in number. These studies are important and valuable in terms of the usefulness of PET-CT in re-staging. However, they cannot contribute to patient selection for NAC. It is known that the hormone receptor positive (HR+) patient group benefited less from NAC and patients with HER2 positivity, triple negativity and high Ki-67 levels benefit more from NAC.10 The response of the breast and axilla to NAC is not always the same. We think there are different factors in breast and axillary response. In this study, we aimed to investigate whether maximum standardized uptake value (SUVmax) values of breast mass and axillary metastatic lymph nodes before NAC are effective independent predictive factors by comparing them statistically with other parameters in predicting both breast and axillary pathological complete response (PCR). After determining the independent parameters that are effective in predicting the response to NAC, nomograms can be created for the breast and axilla with these factors. These nomograms can provide clinicians with the opportunity to make a more objective assessment when making NAC decisions.
Methods
The patients who were T1-4, N1, M0, and who underwent surgery after NAC between January 2019 and August 2023 at Tokat Gaziosmanpaşa Medical Faculty Surgery Clinic were included in our study. The study was conducted prospectively. In all patients, both breast cancer and axillary metastasis were diagnosed by trucut biopsy. The patients with missing data and whose follow-ups were carried out in other hospitals were excluded from the study. Factors investigated in predicting NAC response were age, type of pathology (invasive ductal/invasive lobular), tumor size (T < 5 cm/T ≥ 5 cm), number of axillary pathological lymph nodes (1/≥ 2), HR positivity, HER2 positivity, triple negativity, Ki-67 level (< 14/≥ 14), multifocality, SUVmax of breast mass and axillary SUVmax. A 5-score for the mass in the breast according to the Miller Payne System and lack of any metastasis in the lymph mode for the axilla was considered PCR. Care was taken to ensure that all of the factors investigated were created from the data obtained before the NAC.
Statistical analyses
The statistical analyses of the collected data were conducted using the Statistical Package for the Social Sciences (SPSS) software ver. 18.0 (SPSS Inc., Chicago, IL, USA). The categorical data were presented as percentage. The cut-off value for breast and axillary SUVmax was determined by receiver operative curve (ROC). In the univariate analysis, the comparisons of the factors affecting the breast and axillary PCR after NAC were made by the Pearson Chi-square test. Student t test was used for normally distributed continuous variables. The logistic regression was used to detect the independent factors affecting breast and axillary PCR after NAC and to calculate the odds ratios. Two separate nomograms were created to calculate the probability of breast and axillary complete response using formula E(Y) = pr (Y = 1) = 1/(1 + exp [β0 + Skj βjXi]) and independent predictive factors. The effectiveness of the nomograms created was tested by performing ROC curve analysis using the cut off values obtained from the nomograms. Statistical significance was p < 0.05.
NAC procedure
SELECTION OF PATIENTS FOR NAC
The patients included in our study were the cases who had breast cancer with axillary lymph node metastases, regardless of tumor size, including inflammatory breast cancer, without distant metastases (T1-4, N1, M0), therefore receiving NAC.
PRE-OPERATIVE THERAPY REGIMENS
Patients with HER2-negative breast cancer AC followed by weekly paclitaxel (Doxorubicin 60 mg/m2, Cyclophosphamide 600 mg/m2 cycled every 21 days for 4 cycles followed by paclitaxel 80 mg/m2 weekly for 12 weeks).
PATIENTS WITH HER2-POSITIVE BREAST CANCER
AC followed by docetaxel + trastuzumab + pertuzumab (Doxorubicin 60 mg/m2, Cyclophosphamide 600 mg/m2 cycled every 21 days for 4 cycles followed by pertuzumab 840 mg day 1 followed by 420 mg, trastuzumab 8 mg/kg day 1 followed by 6 mg/kg, and docetaxel 75-100 mg/m2 cycled every 21 days for 4 cycles).
Results
A total of 184 female patients with locally advanced breast cancer and a median age of 54 (range: 25-88) years were included in our study. The general characteristics of the patients and the results of univariate analysis are given in table 1. Of the patients, 51 underwent BCS + SLNB, 32 underwent BCS + SLNB + AD, 25 underwent BCS + AD, 28 underwent mastectomy + SLNB, 15 underwent mastectomy + SLNB + AD, and 33 underwent modified radical mastectomy. According to the post-operative pathology examinations, PCR rates after NAC were 22.8% for breast mass and 36.9% for axilla.
Table 1. General characteristics of the patients and the univariate analysis results
| Characteristics | Breast complete response, n (%) | p | Axillary complete response, n (%) | p | ||
|---|---|---|---|---|---|---|
| Yes | No | Yes | No | |||
| Age (mean±SD) | 55.42 ± 14.23 | 53.94 ± 12 | 0.519 | 54.64 ± 14.72 | 54.06 ± 12.01 | 0.731 |
| Pathology Idc Ilc | 41 (23.6)1 (9) | 132 (76.4)10 (91) | 0.263 | 65 (37.5)3 (27.2) | 108 (62.5)8 (72.3) | 0.493 |
| Size (cm) T < 5 T ≥ 5 | 40 (25.9)2 (6.6) | 114 (74.1)28 (93.4) | 0.021 | 54 (35)14 (46.6) | 100 (65)16 (53.4) | 0.228 |
| Number of pathological lymph node before NAC 1 ≥ 2 | 24 (24.5)18 (21) | 74 (75.5)68 (79) | 0.586 | 42 (43.7)26 (30.2) | 56 (56.3)60 (69.8) | 0.073 |
| HR status Positive Negative | 18 (14.4)24 (40.6) | 106 (95.6)36 (59.4) | < 0.001 | 32 (25.8)24 (40.6) | 92 (74.2)36 (59.4) | < 0.001 |
| HER2 status Positive Negative | 30 (39.4)12 (11.1) | 46 (59.6)96 (88.9) | < 0.001 | 38 (50)30 (27.7) | 38 (50)78 (72.3) | 0.002 |
| Triple negative Yes No | 6 (23)36 (23) | 20 (77)122 (77) | 0.974 | 12 (46.1)56 (35.4) | 14 (53.9)102 (64.6) | 0.294 |
| Ki-67 level < 14 ≥ 14 | 8 (8.8)34 (36.1) | 82 (91.2)60 (53.9) | < 0.001 | 10 (11.1)58 (61.7) | 80 (88.9)36 (38.3) | < 0.001 |
| Multifocality Yes No | 2 (6.6)40 (24.7) | 30 (93.4)122 (75.3) | 0.014 | 2 (6.6)66 (40.7) | 30 (93.4)86 (59.3) | < 0.001 |
| Breast SUVmax-cut off Group 1 (< 9.9) Group 2 (≥ 9.9) | 20 (17.5)22 (31.4) | 94 (82.5)48 (68.6) | 0.029 | 30 (26.3)38 (76) | 84 (73.7)12 (24) | < 0.001 |
| Axillary SUVmax-cut off Group 1 (< 10.1) Group 2 (≥ 10.1) | 28 (20.8)14 (28) | 106 (79.2)36 (72) | 0.307 | 46 (34.3)22 (44) | 88 (65.7)28 (66) | 0.235 |
|
NAC: neoadjuvant chemotherapy; HR: hormone receptor; HER2: human epidermal growth factor receptor 2; SUVmax: maximum standardized uptake value. |
||||||
ROC analysis was performed based on PCR, and separate SUVmax values were for calculated breast and axilla. In our patient series, the cut-off value was 9.9 for breast tumor and 10.1 for axillary metastasis. In the ROC analysis performed with both SUVmax values to predict PCR in the breast, it was found that the breast SUVmax was usable (area under the curve [AUC]: 0.636, p = 0.007, sensitivity: 66.7%, specificity: 72.4%, cutoff: 9.9) while axillary SUVmax was not (AUC: 0.531, p = 0.678) (Fig. 1). In the ROC analysis performed with both SUVmax values to predict axillary PCR, it was revealed that the breast SUVmax was usable (AUC: 0.731, p = 0.000, sensitivity: 67.8%, specificity: 73.6%, cutoff: 10.1) while axillary SUVmax (AUC: 0.578, p = 0.078) was not (Fig. 2).
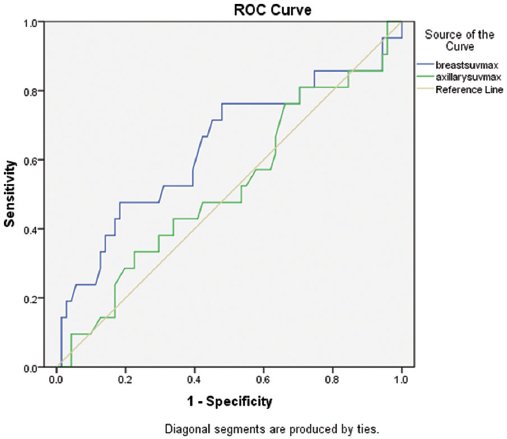
Figure 1. Maximum standardized uptake value (SUVmax) evaluation for breast complete response. Breast SUVmax: Area under the curve (AUC): 0.636, p = 0.007, sensitivity: 66.7%, specificity: 72.4%, cutoff: 9.9. Axillary SUVmax: AUC: 0.531, p = 0.678.
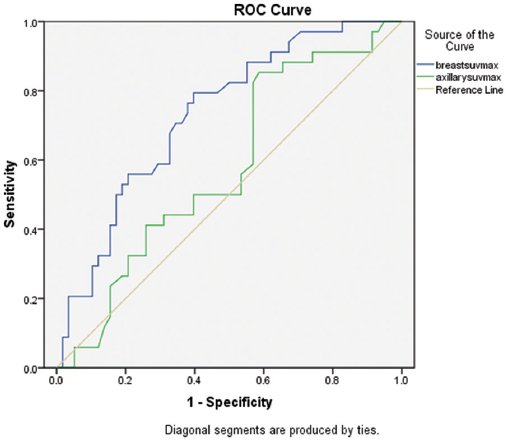
Figure 2. Maximum standardized uptake value (SUVmax) evaluation for axillary complete response. Breast SUVmax: Area under the curve (AUC): 0.731, p = 0.000, sensitivity: 67.8%, specificity: 73.6%, cutoff: 10.1. Axillary SUVmax: AUC: 0.578, p = 0.078.
As a result of univariate analyses, age (p = 519), pathology type (p = 0.263), pathological LN number in the axilla before NAC (p = 0.586), triple negativity (p = 0.974) and axillary SUVmax (p = 0.307) were not significant while tumor size (p = 0.021), HR+ (p < 0.001), HER2 positivity (p < 0.001), Ki-67 level (p < 0.001), multifocality (p = 0.014) and breast SUVmax (p = 0.029) were significant. As a result of logistic regression analysis using factors found significant in univariate analysis, tumor size (p = 0.013), HR+ (p = 0.011), Ki-67 level ≥ 14 (p = 0.02), HER2 positivity (p = 0.006), and breast SUVmax (p = 0.038) were independent factors in predicting PCR after NAC (Table 2).
Table 2. Logistic regression analysis
| Logistic regression | p | OR | 95% CI for EXP.(B) |
|---|---|---|---|
| Breast complete response T < 5-T ≥ 5 HR positive Ki-67 level ≥ 14 HER2 positive Breast SUVmax ≥ 9.9 | 0.0130.0110.020.0060.038 | 4.92.535.85.22.16 | 1.53-36.71.28-71.24-8.341.27-7.061.81-9.54 |
| Axillary complete response HR positive Ki-67 level ≥ 14 Multifocality Breast SUVmax ≥ 10.1 | 0.007< 0.0010.0160.003 | 4.933.378.68.86 | 1.49-7.391.69-3.61.44-32.31.49-7.2 |
|
OR: Odds ratios; CI: Confidence interval, HR: hormone receptor; HER2: human epidermal growth factor receptor 2; SUVmax: maximum standardized uptake value. |
|||
With the nomogram created with the factors obtained, the probability levels of breast PCR were calculated according to the treatment groups. The results showed that the significant cut-off was at the level of 40.5 points. When the calculated value was over 40.5, the probability of PCR increased. In ROC curve analysis, sensitivity was 76.2%, specificity 80.3%, and AUC 0.814 (Fig. 3).
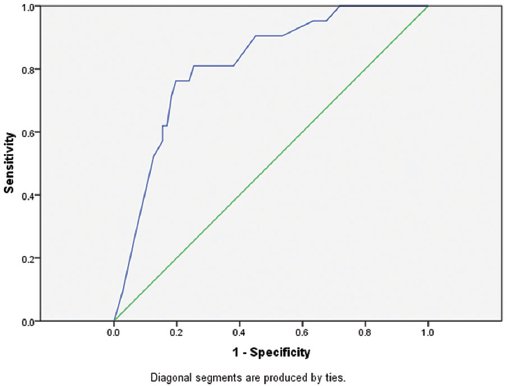
Figure 3. Nomogram receiver operative curve analysis for breast complete response: Area under the curve: 0.81, p < 0.001, sensitivity: 76.2%, specificity: 80.3%, cut of: 40.5.
In univariate analyses performed for axillary PCR, age (p = 0.731), pathology type (p = 0.493), tumor size (p = 0.228), pathological LN count in the axilla before NAC (p = 0.073), triple negativity (p = 0.294) and axillary SUVmax (p = 0.235) were not significant while HR positivity (p < 0.001), HER2 positivity (p = 0.002), Ki-67 level (p < 0.001), Multifocality (p = 0.014) and breast SUVmax (p = 0.029) were significant. As a result of logistic regression analysis performed using factors that turned out to be significant in univariate analysis, HR positivity (p = 0.007), Ki-67 level ≥ 14 (p < 0.001), multifocality (p = 0.016) and breast SUVmax (p = 0.003) were independent factors in predicting axillary PCR after NAC (Table 2).
It was shown in the logistic regression analysis that in order to increase the probability of axillary complete response, HR should not be positive and multifocality should not exist, Ki-67 should be ≥ 14, and breast SUVmax should be higher than 10.1. With the nomogram created with the factors obtained, the probability levels of axillary PCR were calculated according to the treatment groups. According to the results, it was found that the significant cut-off point was 24.5. When the calculated value was over 24.5, the probability of axillary PCR increased. In the ROC curve analysis, sensitivity was 71%, specificity 84.24%, and AUC 0.795 (Fig. 4).
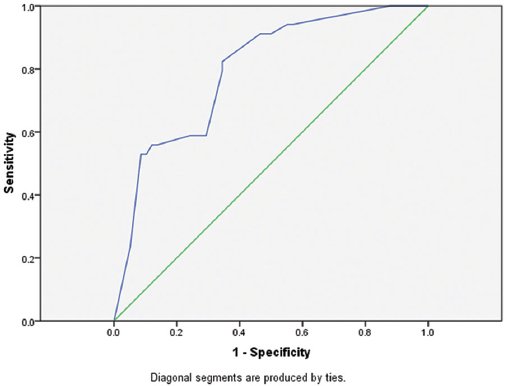
Figure 4. Nomogram receiver operative curve analysis for axillary complete response: Area under the curve: 0.795, p < 0.001, sensitivity: 71%, specificity: 84.24%, cut off: 24.05.
Discussion
SUVmax is defined as the ratio of the maximum intensity of activity in the lesion to the fluorodeoxyglucose (FDG) dose injected per kilogram.11 The SUV value of the primary tumor is directly associated with the subgroups of the tumor, histological grade, proliferation index, and early recurrence.11 FDG uptake may also be affected by the phenotype and mitotic index of the primary tumor.12 It was also shown that SUVmax is associated with tumor mutational burden and the total number of oncogenic anomalies in tissue biopsy.13 Kwon et al.14 reported a correlation between the increase in Ki-67 level and the increase in FDG uptake. According to a meta-analysis of 22 studies and 1630 patients, 18F-FDG PET was found to have a predictive value in the evaluation of response to NAC.15 However, Tian et al. initially reported that the use of 18F-FDG PET/CT to evaluate PCR in tumors with low glucose metabolism was not significant.16 In the light of all these scientific data, it is possible to assume that the SUVmax values obtained before NAC can predict the response to NAC.
The majority of the studies in the literature are 18F-FDG PET/CT studies performed in the early period after NAC initiation or after treatment is completed. In our review of English literature, we identified four studies planned according to the results of 18F-FDG PET/CT before NAC in parallel with our study.17–20 In their study involving 73 patients, Ha et al. reported that PCR could be estimated using radiomics in 18F-FDG PET/CT before NAC and tissue characteristics of the tumor.17 However, contrary to the literature, they concluded that HER2 positivity had no effect on PCR.17 In their study involving 163 patients, Li et al.18 created a model that predicts PCR by combining radiomics and age. Lim et al.19 studied 100 patients and reported that radiomics and HER2 positivity were predictive for PCR and created a model that calculates the probability. In addition to radiomics, Chen et al.20 reported that estrogen receptor, progesterone receptor, HER2, and Ki-67 status were correlated with the results of NAC, and the AUC of the model they created was 0.72. All these four studies involved the use of special software and complex data. In our study, we created two separate models to predict PCR for the breast and axilla using the data of the tumor and the SUVmax, which should be available when the patient is diagnosed.
For PCR in breast, tumor size (p = 0.013), HR+ (p = 0.011), Ki-67 level ≥ 14 (p = 0.02), HER2 positivity (p = 0.006) and breast SUVmax (p = 0.038) were independent factors in predicting PCR after NAC. HR+ (p = 0.007), Ki-67 level ≥ 14 (p < 0.001), multifocality (p = 0.016), and breast SUVmax (p = 0.003) were independent predictive factors for axillary PCR. We confirmed that two separate nomograms established using these factors were effective in predicting PCR for breast and axilla.
The fact that we obtained different predictive factors for breast and axillary PCR could be clinically valuable since this finding implied that differences may occur in the response of the breast and axilla to NAC. Thanks to the formulas and factors we used, we believe that we have created models that can be easily used by clinicians without the need for special software, unlike other studies. Using these models, more objective NAC decisions could be made. The prospective nature of our study and the relatively higher number of patients in the present study compared to similar studies strengthens our results.
Conclusions
The factors affecting the response to NAC were not the same for the breast mass and the axilla. While the breast SUVmax value in the 18F-FDG PET/CT before NAC is an independent predictive factor for both breast and axillary PCR, axillary SUVmax is not an effective factor.
Funding
The authors declare that they have not received funding.
Conflicts of interest
The authors declare no conflicts of interest.
Ethical considerations
Protection of humans and animals. The authors declare that no experiments involving humans or animals were conducted for this research.
Confidentiality, informed consent, and ethical approval. The study does not involve patient personal data. The SAGER guidelines were followed according to the nature of the study.
Declaration on the use of artificial intelligence. The authors declare that no generative artificial intelligence was used in the writing of this manuscript.
All procedures in studies involving human participants were conducted by the 1964 Helsinki Declaration and its later amendments or comparable ethical standards.
