

Introduction
Osteoporosis (OP) is becoming a more and more important public health problem as it causes significant morbidity and mortality, especially in postmenopausal women. OP causes a decrease in bone strength with the loss of bone mass and leads to an increased tendency to fragility fractures.1–3 Therefore, early and accurate diagnosis is essential to prevent its progression and increase life quality. Dual-energy X-ray absorptiometry (DXA), the current gold standard of bone mineral density (BMD) evaluation, is based on a person’s BMD T-score at the hip and lumbar spine. T-scores are derived as the difference between the individual’s BMD and a reference population mean, divided by the reference population standard deviation. The World Health Organization defines OP as a BMD 2.5 standard deviations (SD) or less below the reference population mean, i.e., a T-score of −2.5, whereas osteopenia is a condition of low bone mass characterized by a BMD T-score between −1 and −2.5.1,4
Every year, an increasing number of diagnostic multidetector computed tomography (CT) examinations are performed worldwide to image different anatomical regions, including vertebrae. In the literature, some studies report that there is a significant correlation between bone Hounsfield Unit (HU) obtained from lumbar CT examinations performed for diagnostic purposes other than OP and BMD measurements obtained from DXA.5–7 There are studies where a large data pool is obtained from these diagnostic CT examinations performed with “opportunistic OP screening.” It was stated that L1 trabecular attenuation has normative values, and these values can be a quick reference in OP screening at risk.8 In most of these studies, trabecular component HU measurement was performed using the two-dimensional axial image of the vertebra. In regions such as the vertebra and proximal femur, trabecular bone density and microstructure may not be uniform.9 It is reported that there is a decrease in thickness and number of horizontal and vertical trabeculae in OP.9,10 Therefore, it might be thought that HU measurements obtained from two-dimensional axial CT images may not provide sufficient information about the whole vertebra due to the heterogeneity of trabecular bone. To our knowledge, there is no study comparing volumetric HU values and HU values obtained from two-dimensional axial images.
In this study, we aimed to reveal whether there is a correlation between two-dimensional and volumetric HU value measurements obtained from CT examination and T scores obtained from DXA. In addition, we aimed to find out whether these two HU measurement methods can be used interchangeably.
Methods
Patient selection
We retrospectively reviewed the patients who had undergone either an abdominal or lumbar spinal CT scan, as well as a lumbar spine DXA scan, between January 2017 and December 2020. The time interval between CT and DXA scans required for inclusion was a maximum of 7 months. Patients with lumbar spine surgery or who were below 50 years of age were excluded from the study. Out of 1200 patients initially reviewed, 97 patients (15 males and 82 females) were ultimately included in the study (Fig. 1). The median time between CT and DXA scans for the included cohort was 4.5 months.
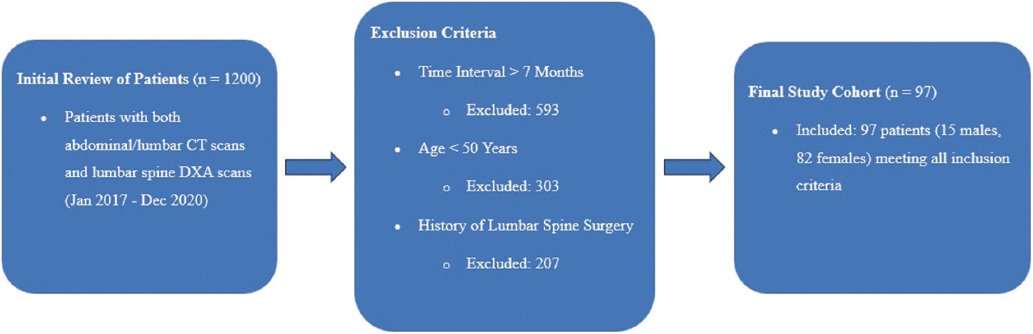
Figure 1. Flowchart of the patient selection.
Balikesir University Clinical Research Ethics Committee approved this study with the decision number of 2021/219 in 2021.
The requirement for informed consent was waived due to the retrospective design of the study, which involved the analysis of pre-existing data.
Imaging technique and analysis
DXA scans were performed using a GE Lunar machine (Lunar Prodigy model 8743; GE Lunar, Madison, WI, USA). The T-score and (BMD, g/cm2) of the L1 to L4 vertebrae were obtained from posteroanterior DXA scans.
CT scans were performed with a helical 64-channel multidetector CT scanner (Toshiba Aquillion 64, Tokyo, Japan). The CT imaging parameters for all patients were a slice thickness of 0.625 mm, tube voltage of 120 kVp, and tube current of 300 mA (with AEC Sure Exposure). Bone reconstruction settings were used (window width/window level –3000/300), and multiplanar reformatted images were acquired for analysis.
HU values were measured on the three axial images (immediately inferior to the superior end plate, mid-body of vertebra, and superior to the inferior end plate) of CT scans from each of the L1-4 vertebrae. Mean HU values were calculated for the regions of interest using the Extreme Picture Archiving and Communication System (Extreme PACS, Ankara, Türkiye) (Fig. 2). Volumetric HU values were calculated using 3D Slicer software version 5.0.3 (www.slicer.org). The segmentation process involved drawing a spherical volume of interest from the superior to the inferior end plate of the vertebra, excluding the basivertebral venous plexus. Mean HU values for each individual vertebra, overall L1-4, and overall L2-4 were obtained from these segmentations via 3D Slicer (Fig. 3).
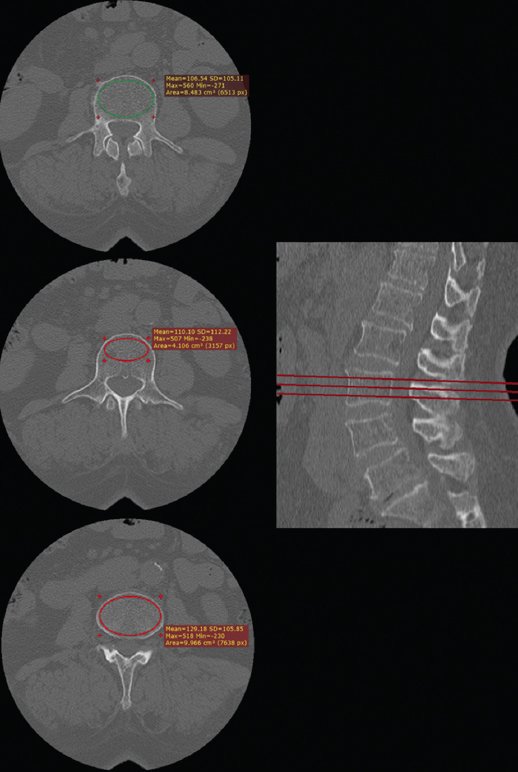
Figure 2. Demonstration of the two-dimensional Hounsfield unit measurement.
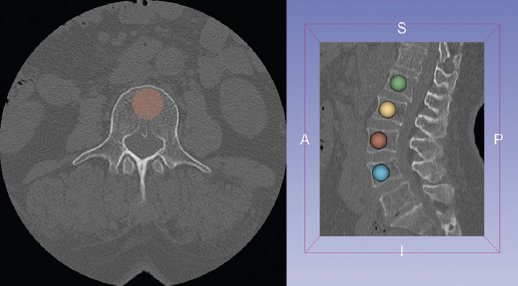
Figure 3. Demonstration of the volumetric Hounsfield unit measurement.
The HU measurements were performed by two experienced radiologists who were blinded to the T scores of DEXA scans and the mean values of the other patients.
Interobserver reliability was assessed using a subset of 30 randomly selected cases, with measurements performed independently by two radiologists to ensure unbiased results.
Statistical analysis
All the statistical analyses were conducted using the Statistical Package for the Social Sciences version 22 and Number Cruncher Statistical System version 11 software for Windows. The normality of the variables was assessed using both visual methods (histogram and probability plots) and the Shapiro-Wilk test. Variables showing normal distribution in groups were analyzed using the Pearson test, whereas variables showing non-normal distribution were analyzed with the Spearman test. Descriptive analyses were given by means and SD after checking normal distribution. Bland-Altman analysis was performed to evaluate agreement between two-dimensional and volumetric HU measurements, and intraclass correlation coefficients (ICC) were calculated to assess interobserver reliability. The interobserver reliability was assessed by calculating the two-way mixed effect model of ICC with absolute agreement. p < 0.05 was considered statistically significant.
Results
Patient demographics and clinical characteristics
A total of 97 patients were included in this study, consisting of 15 males (15.5%) and 82 females (84.5%), with a mean age of 66.48 ± 9.97 years (range: 50-90 years). The body mass index (BMI) of the participants ranged from 18.73 to 42.75 kg/m2, with a mean of 29.61 ± 5.94 kg/m2 (Table 1). All patients had both abdominal and lumbar CT and lumbar DXA scans available, with a maximum interval of 7 months between the two imaging methods.
Table 1. Summary of demographic data and bone mineral density status for the study cohort, including gender distribution, age, BMI, and DXA T-scores across L1-L4 vertebrae
| Characteristic | Total (n = 97) | Osteoporotic (n = 30) | Osteopenic (n = 42) | Normal (n = 25) |
|---|---|---|---|---|
| Age (years) | 66.48 ± 9.97 | 70.1 ± 8.3 | 65.5 ± 9.2 | 63.2 ± 10.4 |
| BMI (kg/m2) | 29.61 ± 5.94 | 30.2 ± 6.1 | 28.8 ± 5.7 | 29.1 ± 5.9 |
| Mean T-score (L1-L4) | –1.00 ± 1.60 | −2.8 ± 0.6 | –1.6 ± 0.4 | –0.3 ± 0.5 |
| Gender distribution | ||||
| Male, n (%) | 15 (15.5) | 5 (16.7) | 7 (16.7) | 3 (12.0) |
| Female, n (%) | 82 (84.5) | 25 (83.3) | 35 (83.3) | 22 (88.0) |
|
CT: computed tomography; HU: Hounsfield unit; DXA: dual-energy X-ray absorptiometry; BMD: bone mineral density; BMI: body mass index. |
||||
DXA T-scores and BMD
The mean T-score for the L1-4 vertebrae was −1.00 ± 1.60, with scores ranging from –4.90 to 3.90. Of the 97 patients, 30 (30.9%) were classified as osteoporotic (T-score ≤ –2.5), 42 (43.3%) as osteopenic (T-score between −1 and −2.5), and 25 (25.8%) as normal (T-score > −1) (Table 1). The mean Z-score for the L1-4 vertebrae was −1.30 ± 1.67, with values ranging from –5.50 to 3.14.
Correlation between CT HU values and DXA T-scores
Pearson correlation analysis demonstrated statistically significant positive correlations between CT-derived HU values and DXA T-scores across all vertebral levels (p < 0.001 for each correlation). The mean two-dimensional HU value for the L1-4 vertebrae correlated with the mean T-score at r = 0.532, whereas the mean volumetric HU value for L1-4 vertebrae exhibited a slightly stronger correlation with the mean T-score at r = 0.572. Similarly, the mean volumetric HU value for L2-4 showed a robust correlation with the mean T-score at r = 0.570. Individual correlations for both two-dimensional and volumetric HU measurements by vertebral level are presented in table 2, where volumetric HU correlations consistently demonstrated higher values than two-dimensional HU measurements.
Table 2. Pearson correlation coefficients showing the relationship between CT-derived HU values (both two-dimensional and volumetric) and DXA T-scores across individual vertebral levels (L1-L4) and averaged segments (L1-L4 and L2-L4)
| Vertebral level | Two-dimensional HU correlation (r) | Volumetric HU correlation (r) |
|---|---|---|
| L1 | 0.528 | 0.579 |
| L2 | 0.540 | 0.591 |
| L3 | 0.493 | 0.524 |
| L4 | 0.552 | 0.593 |
| L1-L4 (mean) | 0.532 | 0.572 |
| L2-L4 (mean) | 0.510 | 0.570 |
|
CT: computed tomography; HU: Hounsfield unit; DXA: dual-energy X-ray absorptiometry. |
||
Subgroup analysis by OP status
When stratified by osteoporosis status (osteoporotic vs. non-osteoporotic), significant differences were found in both two-dimensional and volumetric HU values across all vertebral levels (p < 0.001 for all comparisons). Among osteoporotic patients, the mean two-dimensional HU value for L1-4 was 90.30 ± 35.67, whereas it was 112.45 ± 39.82 for non-osteoporotic patients. In volumetric measurements, the difference was more pronounced, with osteoporotic patients showing a mean L1-4 HU value of 85.62 ± 32.91 compared to 115.73 ± 37.90 for non-osteoporotic patients (Table 3).
Table 3. Mean HU values (both two-dimensional and volumetric) across vertebral levels (L1-L4) for osteoporotic and non-osteoporotic groups, highlighting HU differences associated with osteoporosis
| Vertebral level | Osteoporotic (two-dimensional HU) | Non-osteoporotic (two-dimensional HU) | Osteoporotic (volumetric HU) | Non-osteoporotic (volumetric HU) |
|---|---|---|---|---|
| L1 | 85.62 | 115.73 | 90.30 | 112.45 |
| L2 | 84.20 | 116.25 | 91.80 | 114.10 |
| L3 | 82.30 | 110.50 | 88.10 | 109.90 |
| L4 | 83.40 | 108.80 | 89.60 | 107.90 |
| L1-L4 (mean) | 85.60 | 112.25 | 90.95 | 111.10 |
| L2-L4 (mean) | 83.30 | 111.00 | 89.10 | 110.20 |
|
HU: Hounsfield unit. |
||||
Bland-Altman analysis
Bland-Altman analysis was conducted to assess agreement between two-dimensional and volumetric HU measurements at each vertebral level. The mean bias for all vertebral levels is shown in table 4, with their 95% limits of agreement.
Table 4. Bland-Altman analysis of two-dimensional and volumetric HU measurements across L1-L4 vertebral levels, including mean HU values, bias, limits of agreement, and correlation coefficients for each vertebral level and averaged segments
| Vertebral level | Mean HU (two-dimensional) | Mean HU (volumetric) | Mean bias (two-dimensional-volumetric) | 95% Limits of agreement (HU, HU) | Correlation coefficient |
|---|---|---|---|---|---|
| L1 | 107.30 | 118.26 | –10.96 | (–35.86, 13.93) | 0.95 |
| L2 | 104.80 | 115.25 | –10.44 | (–45.28, 24.40) | 0.91 |
| L3 | 99.22 | 108.62 | –9.40 | (–57.83, 39.03) | 0.84 |
| L4 | 100.39 | 108.18 | –7.79 | (–39.57, 24.00) | 0.92 |
| L1-L4 | 102.40 | 113.25 | –10.85 | (–36.45, 14.75) | 0.94 |
| L2-L4 | 101.22 | 112.47 | –9.70 | (–41.02, 21.62) | 0.90 |
|
HU: Hounsfield unit. |
|||||
ICC
The ICC analysis demonstrated excellent agreement between two-dimensional and volumetric HU measurement methods. The ICC for volumetric HU measurements was 0.951 (95% confidence interval [CI]: 0.927-0.963), whereas the ICC for two-dimensional HU measurements was slightly lower at 0.908 (95% CI: 0.838-0.924).
Interobserver reliability
Interobserver reliability was high for both measurement methods. The ICC for volumetric HU measurements was 0.963 (95% CI: 0.934-0.974), whereas the ICC for two-dimensional HU measurements was 0.918 (95% CI: 0.874-0.972).
Statistical significance and distribution of data
The normality of the HU data was assessed using the Shapiro-Wilk test. For two-dimensional HU measurements, L1, L2, L3, L4, L1-4, and L2-4 demonstrated normal distribution (p > 0.05). In the volumetric HU measurements, L1, L2, L4, L1-4, and L2-4 followed a normal distribution (p > 0.05), whereas L3 did not, with a Shapiro-Wilk p = 0.023.
Discussion
This study reveals significant correlations between CT-derived HU values and DXA T-scores, with volumetric HU measurements consistently exhibiting stronger correlations across all vertebral levels. The observed differences in correlation strength between two-dimensional and volumetric measurements may indicate that volumetric assessments capture bone density more comprehensively, particularly in the trabecular structure, where osteoporosis is most impactful. The Shapiro-Wilk normality test further validates these measurements for parametric analysis, with most levels demonstrating a normal distribution, except for L3 volumetric values. This deviation may reflect specific structural variability in the L3 vertebra, which could influence the consistency of HU values at this level.
Bland-Altman analysis indicated a systematic bias between two-dimensional and volumetric measurements, with two-dimensional HU values tending to underestimate compared to volumetric values. Despite this bias, the 95% limits of agreement across all vertebral levels were within clinically acceptable ranges, supporting the potential interchangeability of these methods. However, volumetric HU measurements may offer higher sensitivity, particularly for research purposes and in populations with heterogeneous bone density distributions, as evidenced by the slightly higher ICCs for volumetric measurements.
The subgroup analysis showed significantly lower HU values for both two-dimensional and volumetric methods in osteoporotic patients, reinforcing the relevance of HU measurements as potential diagnostic tools for opportunistic osteoporosis screening. The high interobserver reliability observed for both methods underscores the clinical applicability and reproducibility of HU measurements, though the enhanced reliability in volumetric measurements makes them particularly suitable for longitudinal studies where precise assessment of trabecular integrity is essential.
These results contribute to the literature by emphasizing the utility of CT-derived HU measurements, especially volumetric methods, as a complement to DXA in osteoporosis assessment. The distinct patterns in L3 volumetric measurements also suggest that vertebral level-specific characteristics could be further explored to improve the accuracy of CT-based bone health evaluations. Future studies may benefit from refining HU thresholds for clinical use, especially in opportunistic screening, and from investigating vertebra-specific variability, such as that observed at L3, to enhance the precision of osteoporosis diagnosis and risk stratification.
Our findings align with several previous studies that reported significant correlations between CT-derived HU values and DXA T-scores.11–31 The literature has consistently demonstrated that HU values obtained from diagnostic CT scans can serve as a proxy for BMD, particularly in opportunistic screening contexts. Notably, studies by Lee et al. and Schreiber et al. have established the value of L1 vertebral attenuation in predicting BMD and identifying patients at risk for OP. However, these studies primarily utilized two-dimensional HU measurements.12,13
By introducing and evaluating volumetric HU measurements, our study expands upon this body of work. Volumetric assessments provide a 3D representation of trabecular bone, which has been shown to have non-uniform density and microstructure, particularly in osteoporotic bones. The findings suggest that volumetric HU measurements offer a more accurate representation of overall bone health, particularly in patients with advanced OP, where trabecular thinning and heterogeneity are more pronounced. One of the key implications of our study is the potential for volumetric HU measurements to enhance the accuracy of opportunistic OP screening during routine diagnostic CT scans. Given the strong correlation between volumetric HU values and T-scores, this method could be integrated into clinical workflows to identify at-risk patients without requiring additional imaging or radiation exposure. Furthermore, the ability to assess bone quality volumetrically could have implications not only for screening but also for monitoring OP treatment. Volumetric measurements may allow for more precise tracking of changes in trabecular structure over time, providing clinicians with valuable insights into treatment efficacy. To our knowledge, this is the first study to compare the correlation between two-dimensional and volumetric HU values with DXA T-scores. Our findings highlight the potential of volumetric HU measurements as a novel and promising method for opportunistic OP screening, demonstrating a stronger correlation with DXA T-scores compared to two-dimensional HU values. This is also the second study to evaluate bone health in the lumbar spine using volumetric HU measurements. In their study, Fujimoto et al. compared two-dimensional and volumetric HU values with DXA-derived BMD and demonstrated that volumetric HU values exhibited a stronger correlation with BMD. This finding further supports the growing evidence that volumetric assessments may provide a more comprehensive and accurate representation of trabecular bone density.32
Another significant clinical implication of this study is the potential for using CT HU measurements in therapeutic decision-making. As demonstrated, volumetric HU assessments reflect bone density more comprehensively than two-dimensional methods. Future research could explore the role of these measurements in adjusting treatment protocols, particularly for patients who show varying responses to OP therapy.
Our study also highlights the importance of understanding the trabecular architecture in OP diagnosis. Trabecular bone is composed of horizontal and vertical trabeculae, and its microstructure is often compromised in osteoporotic patients.33 Volumetric methods, by capturing a 3D image of the entire vertebral body, offer a more nuanced understanding of trabecular deterioration, including vertical trabecular thinning, which is particularly critical in predicting fracture risk. This is the superiority of volumetric measurements over two-dimensional slices, which may only capture a limited view of trabecular bone architecture.
While our study suggests that CT-derived HU values are promising for opportunistic screening, it is important to consider the associated radiation dose. Diagnostic CT scans expose patients to significantly higher levels of radiation compared to DXA, which remains the gold standard for OP diagnosis.1,2,34 However, technological advances in CT imaging, including dose reduction techniques, may mitigate these concerns, making CT-based screening more feasible in the future. Studies focused on reducing radiation exposure without sacrificing image quality could further support the integration of CT HU measurements into routine clinical practice.
Beyond the technical and diagnostic advantages, opportunistic screening using CT scans could have a positive impact on healthcare costs. Early identification of OP through routine CT scans could prevent fractures and reduce the long-term costs associated with treating osteoporotic fractures. Implementation of HU measurements as part of routine diagnostics may prove to be a cost-effective strategy, particularly in healthcare systems where high-risk populations undergo frequent CT imaging for other reasons without additional radiation exposure.8,35–38
A major strength of this study is the innovative use of 3D segmentation software for volumetric HU measurements. While almost all the previous studies have primarily focused on two-dimensional measurements, our study demonstrates that volumetric assessments provide a more comprehensive evaluation of trabecular bone density. The high (ICC > 0.9) between observers further confirms the reliability of these measurements, suggesting that they can be consistently applied in both clinical and research settings.
Despite its strengths, this study has several limitations that warrant attention. First, the sample size of 97 patients is relatively small, limiting the ability to establish clinical thresholds for HU values. Larger studies are needed to define reliable cutoff values. In addition, the study population, restricted to individuals aged 50 and older, limits the generalizability of findings to younger populations. The 7-month interval between CT and DXA scans introduces potential variability, particularly in older adults. Furthermore, this study focused solely on trabecular bone, without considering cortical bone, which also contributes to overall bone strength.
Conclusions
This study demonstrates that both two-dimensional and volumetric CT HU measurements are strongly correlated with DXA T-scores, with volumetric measurements offering a more comprehensive assessment of trabecular bone density. These findings support the potential for volumetric HU measurements to be integrated into clinical practice for opportunistic OP screening, as well as for monitoring treatment efficacy. Further research is needed to establish standardized HU thresholds for clinical use, particularly in larger and more diverse populations. In addition, future studies should explore the incorporation of cortical bone assessments and investigate strategies to minimize radiation exposure.
Funding
The authors declare that they have not received funding.
Conflicts of interest
The authors declare no conflicts of interest.
Ethical considerations
Protection of human subjects and animals. The authors declare that no experiments on humans or animals were performed for this research.
Confidentiality, informed consent, and ethical approval. The authors have obtained approval from the Ethics Committee for the analysis of routinely collected and anonymized clinical data; therefore, individual informed consent was not required. Relevant ethical recommendations have been followed.
Declaration on the use of artificial intelligence. The authors declare that an artificial intelligence tool was used to support the preparation of the manuscript.
