

Introduction
Parathyroid tumors are a relatively homogeneous group of neoplasms, affecting approximately 0.1-0.3% of the population. These tumors are primarily characterized by the dysregulation in the secretion of parathyroid hormone (PTH), resulting in primary hyperparathyroidism (PHPT).1 Among patients with PHPT, around 10% present with parathyroid hyperplasia, 85% with a single parathyroid adenoma (PA), and 3% with multiple PAs, whereas fewer than 2% of cases involve atypical parathyroid tumors (APT) or parathyroid carcinomas (PC).2
APTs represent a distinct clinical entity, a state considered to be in between benign PAs and malignant PCs. These tumors exhibit atypical cytological and/or architectural characteristics but do not demonstrate definitive evidence of capsular, vascular, perineural, or adjacent tissue invasion, nor metastasis. Previously termed atypical PA, the nomenclature has been updated to APT in the 5th edition of the World Health Organization (WHO) classification of endocrine tumors.3
The classification of APTs has been controversial due to their ambiguous features, both clinically and histopathologically. However, in 2018, the American Joint Committee on Cancer added the “Tis” category to the staging of parathyroid cancers, defining “Tis” as an atypical parathyroid neoplasm with uncertain malignant potential.4 Similarly, according to the 2022 WHO classification, APTs are categorized as neoplasms of uncertain malignant potential.
Symptoms and findings in APT patients include nephrolithiasis, fatigue, bone pain, brown tumors, and depression. Importantly, these findings are not specific to APTs.2 Most APTs behave similarly to PAs and do not recur after surgical excision. However, recurrent disease and metastasis have been reported, particularly in cases with parafibromin (PFIB) (a tumor suppressor protein, PFIB) deficiency.5–8 Therefore, management of APTs is recommended to consist solely of clinical and biochemical follow-up.3
The primary aim of this study was to identify distinct morphological and laboratory characteristics of APTs, beyond histopathological findings, that differentiate them from PAs and to establish pre-operative markers suggestive of APT. The secondary aim was to compare the short- and long-term outcomes of these two parathyroid neoplasms.
Methods
In this retrospective study, data were collected from patients who underwent surgery for PHPT at our hospital between January 2010 and December 2022. A total of 486 patients underwent surgery during this period. Of these, 77 patients were excluded due to chronic renal failure (n = 12), secondary or tertiary hyperparathyroidism (n = 9), familial syndromes, including MEN1 and MEN2A (n = 4), carcinoma (n = 6), and incomplete medical records (n = 46). Ultimately, 359 patients were diagnosed with PA, and 50 with APT. Fifty patients diagnosed with APT and one hundred patients with PA, who were treated during the same period, were randomly selected for inclusion in the study. To minimize selection bias, the 100 PA patients were selected from the 351 eligible cases using R statistical software. Each patient was assigned a unique identifier, and simple random sampling without replacement was performed with a fixed random seed to ensure reproducibility and maintain methodological rigor.
Demographic data (age, sex), date of surgery, date of the last evaluation (the most recent serum calcium [Ca] and PTH levels and/or neck imaging recorded in the medical files were considered as the date of the last evaluation), concurrent thyroid surgery was documented. Tumor localization, size, volume (parathyroid tumors were considered as ellipsoid objects, and the volume was calculated using the formula 4/3 πabc (where a, b, and c represent the radii). Biochemical data included pre-operative serum calcium (Ca, mg/dL) and PTH (pg/mL) levels, which were obtained from the records. For the pre-operative values, the highest measurements within the month preceding surgery were considered. The reference ranges for Ca and PTH were 8.5-10.5 mg/dL and 15-60 pg/mL, respectively. Histopathological features observed in APTs were documented. Microscopy findings in pathology reports were re-evaluated based on the 2022 WHO classification updates for parathyroid tumors and ranked according to their frequency.
Recurrent laryngeal nerve injury was defined as a known injury occurring during surgery, as documented in the operative report, and/or based on evidence of hypomobility or immobility observed upon post-operative clinical laryngoscopy. No improvement in nerve function within 6 months was considered as permanent nerve damage. The absence of a decrease in PTH and Ca levels in the post-operative period was considered as persistent disease. Disease recurrence was defined as the reappearance of hypercalcemia along with elevated serum PTH levels after a disease-free period (normocalcemia) of at least 6 months. Patients who, within the first seven post-operative days and in the presence of normal or elevated PTH levels, developed hypocalcemia symptoms (e.g., paresthesia or muscle spasms) requiring intravenous Ca supplementation, or exhibited a serum Ca concentration below 7.5 mg/dL, were considered to have hungry bone syndrome (HBS).
This study was approved by the Ethics Committee of Ankara Bilkent City Hospital (Approval number E2-23-3377).
Statistical analysis
A power analysis was conducted to determine the required sample size for detecting a significant difference between PA and atypical parathyroid adenoma (APT) groups. The effect size was set at 0.50 (moderate effect), with an alpha level of 0.05 and a power of 80% (β = 0.20). Due to the unequal sample allocation (n2/n1 = 0.5), the required total sample size was adjusted accordingly. Using G*Power 3.1, the estimated minimum sample size for an independent samples t-test with this allocation ratio was n1 = 96 (PA), n2 = 48 (APT), total = 132. For this reason, this study included 100 PA and 50 APT patients.
All statistical analyses were performed using R (version 4.4.1). Continuous variables were tested for normality using the Shapiro–Wilk test. Normally distributed data were presented as mean ± standard deviation and compared using the independent samples t-test. Non-normally distributed data were expressed as median and interquartile range (IQR, 25-75th percentile) and compared using the Mann-Whitney U test. Categorical variables were presented as frequencies and percentages (%) and compared using the Chi-square test or Fisher’s exact test, as appropriate. A receiver operating characteristic (ROC) curve analysis was performed to determine the diagnostic performance of pre-operative calcium and PTH levels in distinguishing atypical parathyroid adenoma (APT) from PA. The area under the curve (AUC) was calculated, and optimal cutoff values were determined. Sensitivity, specificity, positive predictive value, and negative predictive value were reported. To identify independent predictors of APT, a multivariate logistic regression analysis was performed, including variables that were statistically significant in univariate analysis (p < 0.05). Results were expressed as odds ratios (OR) with 95% confidence intervals (CI). The goodness-of-fit of the final model was assessed using the Hosmer-Lemeshow test.
Results
A total of 150 patients were included in the study, with 100 diagnosed with PA and 50 with APT. The mean age of patients with PA was significantly higher (56 ± 13 years) compared to those with APT (50 ± 12 years, p < 0.005). The sex distribution did not differ significantly between the two groups (p = 0.899).
The median lesion diameter was larger in APT cases (20 mm, IQR 15-27) compared to PA (17 mm, IQR 13-21), though this difference did not reach statistical significance (p = 0.054). The median lesion volume was also higher in APT patients (996.5 mm3, IQR 563-2612) compared to PA (734.34 mm3, IQR 370.44-1382.3), but the difference was not statistically significant (p = 0.085) as shown in table 1. The distribution of lesion localization differed significantly between groups (p < 0.05). APT lesions were most frequently found in the left superior and right inferior positions, while PA lesions showed a more even distribution. Concomitant thyroid surgery was significantly more common in APT patients, with 42% undergoing lobectomy and 32% requiring total thyroidectomy, compared to 20% and 12%, respectively, in PA patients (p < 0.005).
Table 1. Patients demographics, adenoma characteristics, and laboratory measurements
| Variables | Parathyroid adenoma (n = 100) | Atypical parathyroid tumor (n = 50) | p |
|---|---|---|---|
| Age* | 56 ± 13 | 50 ± 12 | < 0.005 |
| Sex† | 29 (29) | 15 (30) | 0.899 |
| Median lesion diameter (mm)‡ | 17 (13-21) | 20 (15-27) | 0.054 |
| Volume (mm3)‡ | 734.34 (370.44-1382.3) | 996.5 (563-2612) | 0.085 |
| Localization† Left superior Left inferior Right inferior Right superior | 9 (9)45 (45)34 (45)12 (12) | 10 (20)12 (24)20 (40)8 (16) | < 0.05 |
| Concurrent thyroid surgery† None Lobectomy Thyroidectomy | 68 (68)12 (12)20 (20) | 21 (42)16 (32)13 (26) | < 0.005 |
| Pre-operative Pth (pg/dL)‡ | 166.3 (127.5-268.2) | 242.75 (185-407.5) | < 0.001 |
| Pre-operative Ca (mg/dL)‡ | 11.03 (10.79-11.72) | 11.93 (11.33-12.2) | < 0.001 |
| Post-operative PTH (pg/dl)‡ | 23 (13-36) | 30.15 (12.52-52.10) | 0.369 |
| Post-operative Ca (mg/dL)‡ | 9 (8.6-9.39) | 8.95 (8.51-9.32) | 0.354 |
| Pth > 180 pg/mL‡ | 42 (42) | 38 (76) | < 0.001 |
| Ca > 11.5 mg/dL‡ | 31 (31) | 35 (70) | < 0.001 |
| Last PTH measurement (pg/dL)‡ | 44.85 (35.20-54.81) | 44.35 (34.9-56.3) | 0.897 |
| Last Ca measurement (mg/dL)‡ | 9.50 (8.44-9.52) | 9.40 (8.90-9.62) | 0.444 |
* Values presented as the mean ± standard deviation.
† Values presented as the number of patients (percentage).
‡ Values presented as the median days (25-75th percentile).
Preoperatively, APT patients exhibited significantly higher PTH and Ca levels compared to PA patients. The median pre-operative PTH level in APT cases was 242.75 pg/dL (IQR 185-407.5), significantly higher than in PA cases (166.3 pg/dL, IQR 127.5-268.2; p < 0.001). Similarly, pre-operative calcium levels were significantly elevated in APT patients (11.93 mg/dL, IQR 11.33-12.2) compared to PA patients (11.03 mg/dL, IQR 10.79-11.72; p < 0.001). However, post-operative PTH and Ca levels were not significantly different between the groups (p = 0.369 and p = 0.354, respectively).
Post-operative complications were more frequent in APT patients. Temporary recurrent nerve paralysis occurred in 16% of APT cases versus 6% of PA cases (p < 0.05). The incidence of “hungry bone syndrome” was also significantly higher in APT patients (16% vs. 3%, p < 0.005). Permanent recurrent nerve paralysis, post-operative disease persistence, and recurrence rates did not significantly differ between groups as shown in table 2.
Table 2. Post-operative complications and follow-up results
| Complications | Parathyroid adenoma (n = 100) | Atypical parathyroid tumor (n = 50) | p |
|---|---|---|---|
| Temporary recurrent nerve paralysis† | 6 (6) | 8 (16) | < 0.05 |
| Permanent recurrent nerve paralysis† | 1 (1) | 0 (0) | 0.478 |
| Hungry bone syndrome† | 3 (3) | 8 (16) | < 0.005 |
| Temporary hypoparathyroidy† | 5 (5) | 4 (8) | 0.466 |
| Permanent hypoparathyroidy† | 1 (1) | 1 (1) | 0.615 |
| Persistent disease | 3 | 2 | |
| Recurrence disease | 0 | 0 | |
|
*Values presented as the mean ± standard deviation. † Values presented as the number of patients (percentage). |
|||
Table 3 demonstrates the frequency of histopathological features observed in APT cases. Among APT cases, fibrotic bands were the most frequently observed histopathological feature (84%), followed by tumor cells in the capsule (40%) and atypical mitosis (36%). Trabecular growth was present in 28% of cases, while adhesion and Ki-67 proliferation index > 5% were each observed in 18% of cases. Increased mitotic activity (> 5/10 mm2) and coagulative necrosis were the least common feature (4%) (Fig. 1).
Table 3. Histopathological features of atypical parathyroid tumors
| Histopathological features | Frequency n (%) |
|---|---|
| Band-like fibrosis | 42 (84) |
| Tumor cells in capsule | 20 (40) |
| Atypical mitotic figures | 18 (36) |
| Trabecular growth | 14 (28) |
| Adherence to adjacent structures | 9 (18) |
| Ki-67 labeling index > 5% | 9 (18) |
| Increased mitotic activity (> 5/10 mm2 | 2 (4) |
| Coagulative necrosis | 2 (4) |
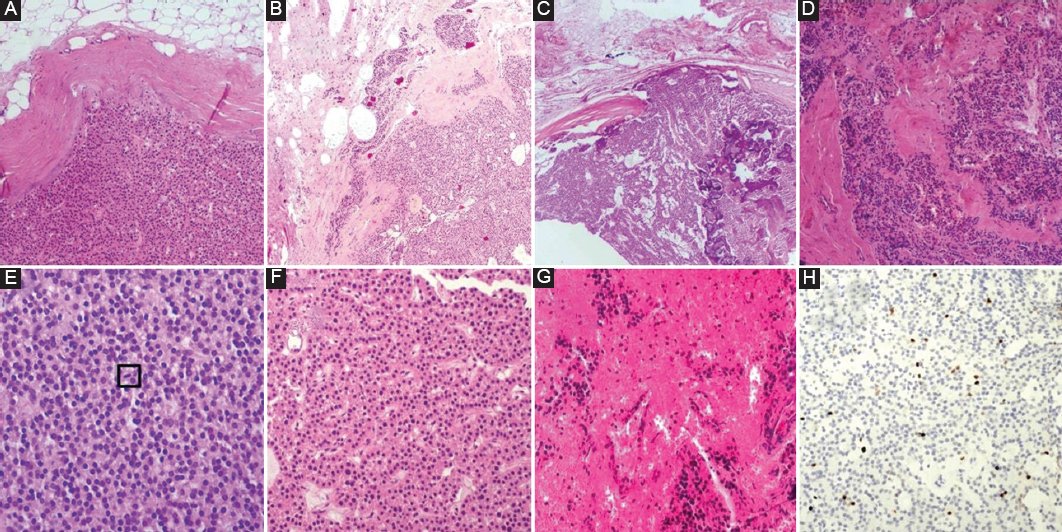
Figure 1. Histological features of atypical parathyroid tumor. Histological features of atypical parathyroid tumor. A: solid growth pattern formed by oncocytic cells and the thick fibrous capsule that develops it (×100 hematoxylin and eosin [H&E]). B and C: extension into the capsule that does not completely exceed the characteristics of the chief cell (×40 H&E). D: band-like fibrosis within the tumor (×100 H&E). E: increased mitotic figure, in square (×400 H&E). F: trabeküler growth patern and pleomorfizm (×200 H&E). G: coagulative necrosis within the tumor (×200 H&E). H: growth staining in Ki-67 immunohistochemical test (×200).
Table 4 provides the details of the ROC curve analysis, and figures 2 and 3 illustrate the ROC curves for pre-operative PTH and Ca, respectively. ROC analysis was performed to determine the optimal cutoff values for distinguishing APT from PA. The AUC for calcium was 0.751 (95% CI: 0.672-0.830, p < 0.001), with an optimal cutoff of 11.5 mg/dL, yielding a sensitivity of 70% and specificity of 69%. The AUC for PTH was 0.691 (95% CI: 0.607-0.775, p < 0.001), with an optimal cutoff of 180 pg/dL, demonstrating a sensitivity of 76% and specificity of 58%. According to these results, A significantly higher proportion of APT patients had PTH levels exceeding 180 pg/mL (76% vs. 42%, p < 0.001) and calcium levels > 11.5 mg/dL (70% vs. 31%, p < 0.001).
Table 4. Areas under curve for biochemical parameters for distinguishing PA from APT
| Variables | AUC | 95% CI | p | Cut-off | Sensitivity | Specificity | PPV | NPV |
|---|---|---|---|---|---|---|---|---|
| Ca | 0.751 | 0.672-0.830 | < 0.001 | > 11.48 | 0.70 | 0.69 | 0.53 | 0.82 |
| PTH | 0.691 | 0.607-0.775 | < 0.001 | > 182 | 0.76 | 0.58 | 0.48 | 0.83 |
|
AUC: area under the curve; CI: confidence interval; PA: parathyroid adenoma; APT: atypical parathyroid adenoma; PPV: positive predictive value; NPV: negative predictive value; PTH: parathyroid hormone. |
||||||||
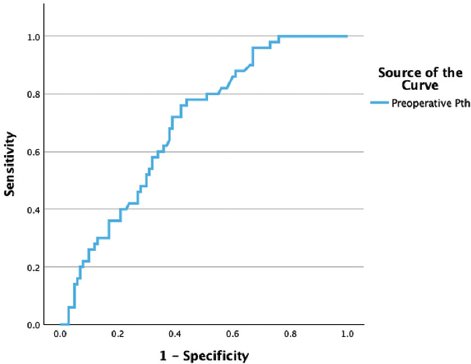
Figure 2. Receiver operating characteristic curve analysis for pre-operative parathyroid hormone (area under the curve: 0.691, sensitivity: 76%. Specificity: 58%, positive predictive value: 48%, negative predictive value: 83%).
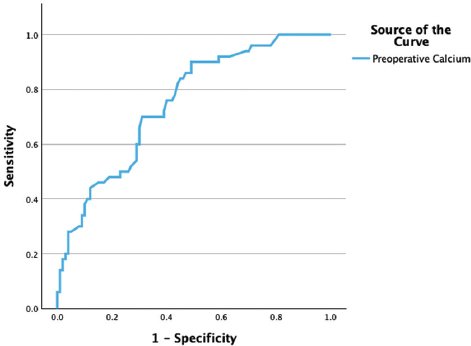
Figure 3. Receiver operating characteristic curve analysis for pre-operative calcium (area under the curve: 0.751, Sensitivity: 70%, Specificity: 69%, positive predictive value: 53%, negative predictive value: 82%).
Multivariate logistic regression analysis identified calcium > 11.5 mg/dL as an independent predictor of APT (OR: 3.571, 95% CI: 1.604-7.950, p < 0.005), along with PTH > 180 pg/dL (OR: 1.127, 95% CI: 1.127-6.069, p < 0.05). Tumor volume did not show a significant association (p = 0.886). Table 5 presents the results of the multivariate analysis.
Table 5. Multivariate analysis of variables independently associated with the presence of APTs
| Variables | Odds ratio | 95% CI | Wald | p | |
|---|---|---|---|---|---|
| Lower | Upper | ||||
| Ca > 11.5 mg/dL | 3.571 | 1.604 | 7.950 | 9.716 | < 0.005 |
| Pth > 180 pg/dL | 1.127 | 1.127 | 6.069 | 5.007 | < 0.05 |
| Volume | 1.000 | – | – | 0.021 | 0.886 |
Discussion
In this study, our primary aim was to identify distinct morphological and laboratory characteristics of APTs, beyond histopathological findings, that differentiate them from PAs and to establish pre-operative markers suggestive of APT. Our secondary aim was to compare the post-operative complications and long-term follow-up outcomes of these two parathyroid neoplasms.
Consistent with the literature,9,10 no significant difference in gender distribution was observed between patients with APT and PA. However, both APTs and PAs were more frequently diagnosed in females. Although some previous studies suggest that APTs and PAs typically occur at similar ages,9,11 the present study found that APTs manifested at a younger age (median age: 50 ± 12) than PAs. Indeed, Chen et al. evaluated 79 APT patients and reported that APTs were diagnosed at a younger age (median age: 46.9 ± 17.1) than PAs, attributing this to possible germline mutations.12
Many studies have compared sizes of parathyroid neoplasms. Although Marini et al. found no significant size difference between atypical tumors and carcinomas,13 it is generally accepted that PCs are larger than other neoplasms.12,1–16 Size comparisons in the literature primarily focus on PCs versus APTs, and few studies include PAs in such analyses. One example is the study by Chen et al., which evaluated characteristics of PAs, APTs, and PCs together. They reported significant differences in size among the groups, with APTs occupying an intermediate position between PAs and PCs. In the present study, the median diameter was 17 mm (13-21) for PAs and 20 mm (15-27) for APTs, showing borderline significance (p = 0.054). Considering that a single diameter measurement may not always accurately reflect lesion volume, we calculated lesion volumes, unlike prior studies. APTs were found to be larger in volume compared to PAs (median: 996.5 mm3 vs. 734.34 mm3), but the difference was not statistically significant (p = 0.085). Consistent with the literature, these results suggest that APTs tend to be larger. However, no definitive cutoff values for size or volume could be established for APTs, indicating that pre-operative differentiation of APTs from PAs based on size alone remains challenging.
PHPT often presents with mild hypercalcemia (serum Ca < 11 mg/dL).17 Studies comparing Ca and PTH levels in patients with PA, APT, and PC have shown that the increase in Ca and PTH levels in patients with APT is not as high as that in patients with PC.18–20 Cakir et al. and McCoy et al. compared APTs with PAs and PCs and found significant differences among these three patient groups in terms of PTH and Ca levels.10,18 Cakir et al. grouped APT and PC under “aggressive tumors” and compared them with PA. Their analysis identified a cutoff value for Ca (12.45 mg/dL), but not for PTH levels. In the present study, significant differences in Ca and PTH levels were observed between patients with APT and those with PA, with cutoff values established as 11.50 mg/dL and 180 pg/mL, respectively. We attribute the higher Ca cutoff reported by Cakir et al. to their inclusion of patients with PC, rendering their cutoff of 12.45 mg/dL less applicable for patients with APTs. To the best of our knowledge, the present study is the first to report cutoff values for distinguishing APTs from PAs.
Data on the most common gland from which PAs originate, and therefore, the most common localization of PAs, are very limited. In the present study, a significant difference was observed between the anatomical localization of APTs and PAs. APTs were predominantly located in the left superior and right inferior poles, whereas PAs showed a homogeneous distribution.
The coexistence of thyroid disease with PHPT has been reported in 22-70% of cases since the 1950s.21–23 In the present study, concurrent thyroid surgery (lobectomy or total thyroidectomy) was performed in 58% of APT patients versus 32% of PA patients. The difference between these rates was statistically significant. This finding is consistent with the result reported by Chen et al.12 We hypothesize that the higher rate of thyroid surgery in APT patients may be due to concomitant thyroid pathology as well as tumor adherence to thyroid tissue. Therefore, in patients with a strong suspicion of APT, the potential need for concurrent thyroidectomy should be considered pre-operatively, and patients should be informed accordingly.
In the present study, patients were evaluated postoperatively for transient/permanent nerve injury, transient/permanent hypoparathyroidism, and HBS. No studies have compared nerve injury rates between APT and PA patients thus far. However, Gurrado et al. reported transient nerve injury in 3.16% and permanent nerve injury in 1.4% of APT patients.15 Tang et al. documented a nerve injury rate of 14% in APT patients.24 In the present study, transient nerve injury occurred in 16% of APT patients, with no permanent nerve injury observed. In PA patients, these rates were 6% and 1%, respectively. Transient nerve injury was significantly more common in APT patients compared to that in PA patients. We hypothesize that this higher risk in APT patients may stem from tumor adherence to nerves/adjacent tissues or the higher frequency of concurrent thyroid surgery. Based on these findings, we suggest that intraoperative nerve monitoring and heightened surgical caution should be considered for patients with pre-operative Ca > 11.50 mg/dL and PTH > 180 pg/mL. Gurrado et al. reported transient hypoparathyroidism in 22.3% and permanent hypoparathyroidism in 4.1% of APT patients.15 In the present study, these rates were 8% and 1%, respectively, with no significant difference compared to these rates in PA patients.
HBS is characterized by post-operative hypocalcemia, hypophosphatemia, and prolonged hypocalcemia.25 It occurs in 12-25% of cases after parathyroidectomy.26 Tang et al. observed HBS in 7% of APT patients in the post-operative period.24 In the present study, these rates were 16% in APT patients and 3% in PA patients, and the difference was statistically significant. Based on these data, we recommend that patients with a strong suspicion of APT should be monitored more closely for the risk of HBS, and pre-operative initiation of calcitriol and oral calcium supplements should be considered to mitigate this risk.
In 2022, the WHO reclassified parathyroid tumors, defining the atypical APT diagnostic criteria as follows: cellular nests in a thickened connective tissue, tumor cells in the capsule, adherence to adjacent structures without frank invasion, band-like fibrosis, trabecular growth, increased mitotic activity (> 5/10 mm2), atypical mitotic figures, coagulative necrosis, PFIB loss, and a Ki-67 labeling index > 5%. APT cases were further stratified into PFIB-positive (PFIB+) and PFIB-negative (PFIB−) groups, with PFIB+ tumors classified as very low-risk and PFIB− as low-risk for recurrence.3 In the present study, histopathological features of APT patients were reassessed against these criteria, confirming all diagnoses. Band-like fibrosis (84%) and tumor cells within the capsule (40%) were most common, while coagulative necrosis and increased mitotic activity (> 5/10 mm2) were rare (4%). Other histopathological features were detected at varying frequencies.
To date, there are no specifically established guidelines for the post-operative follow-up of patients with APT. While some studies, despite the low risk of recurrence, recommend close follow-up of patients independent of immunohistochemical results based on their own experience,27,28 other researchers advocate for close followup in patients with germline gene mutations and/or complete loss of PFIB expression.5,8,29 Several studies did not report any recurrence during follow-up;11,18,24 however, one study reported a recurrence rate of 5.3%.13 In the present study, median follow-up time was 4.8 years. During this period, no recurrence was observed in either group. However, persistent disease necessitating a second operation was observed in three patients with PA and two patients with APT. In patients with persistent PA, the adenomas were not completely removed during the first operation. In APT patients, persistent disease was attributed to incomplete initial tumor resection or additional adenomas. Although no significant difference was detected between the two groups in terms of persistent disease and recurrence, we recommend closer follow-up for patients with atypical tumors compared to that for those with adenomas; this recommendation is due to the serious histopathological findings observed in the atypical tumor group.
Conclusions
Pre-operative identification of APTs is critical. Ca > 11.50 mg/dL and PTH > 180 pg/mL values can be used to differentiate APTs from benign adenomas. Patients with these values should be provided with detailed pre-operative counseling regarding possible concomitant thyroid surgery, nerve injury, and HBS complications. No recurrence was observed in our follow-up, we recommend stricter and more vigilant monitoring for APTs compared to adenomas due to their concerning histopathological features.
Limitation
The limitations of this study include its retrospective nature, which inevitably leads to data loss. Other limitations are that the surgical treatment and histopathological examination were not performed by the same physicians, and the cases could not be grouped according to PFIB status.
Funding
The authors declare that they have not received funding.
Conflicts of interest
The authors declare no conflicts of interest.
Ethical considerations
Protection of human subjects and animals. The authors declare to have followed the ethical standards of the relevant experimentation committee, according to the World Medical Association and the Declaration of Helsinki. The procedures were approved by the institutional Ethics Committee.
Confidentiality, informed consent, and ethical approval. The authors have obtained approval from the Ethics Committee for the analysis of routinely collected and anonymized clinical data; therefore, individual informed consent was not required. Relevant ethical recommendations have been followed.
Declaration on the use of artificial intelligence. The authors declare that no generative artificial intelligence was used in the writing or creation of the content of this manuscript.
